COVID-19 Links, facts and discussion. Politics and hyperbole welcome.

Status
Not open for further replies.
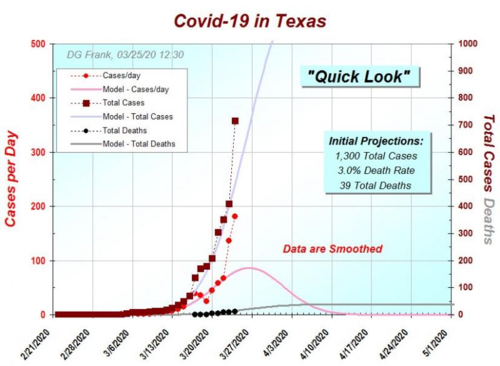
Y'all can follow along with me in my state if you would like. Dr. Frank makes a note on this model about the sudden increase in reported cases (the red dots above the pink curve). I posted it below the model. @ImBillT, this might help to answer your question at least partially about the different methods of testing in different areas and how that affects modeling. Number of deaths is the most accurate variable in the equation because we know fairly close the true numbers of people dying from corona. The number of reported cases is less reliable so it doesn't "carry as much weight" in the model as the number of deaths. They are compared together and some judgement is used based on how the models behaved in the countries that are further along in this ordeal.
1585200588242.png

Covid-19 "Quick Look at Texas"

Just added data. Clearly a testing artifact. We've learned to ignore these for a couple days, then revise the forecast.

Remember, a sudden increase in reported cases will correspond to a sudden increase in deaths, if it is real. Otherwise, the sudden increase in positive test results merely reflects detecting a higher *fraction* of the cases, not a real increase in the number of cases.
 
This guy, Dr. Shiva Ayyadurai, MIT PhD
Appears to be an expert in this discussion, and is running to take Pocahontas seat. Not a fan of Dr. Fauci.
Open letter to the President of the United States to restore the immune and economic health in short order for the American people.

 
One cousin has DR & nurse buds in the thick of it in Boston. They noticed several patients with bad cases have Ibuprofin in their systems and it seems to thrive on it & Tylenol. One a 38 yr old.
 
Just an observation...

I’m seeing lots of graphs with no data or methods attached. Impossible to evaluate or draw any conclusions about models, etc. because figures alone don’t tell you anything. Posting results without the supporting data and methods is generally a red flag.

You can not evaluate a meal by looking at the parsley.
Just so you know I am not trying to hide anything and I'm trying to share as much pertinent information as I know how. The model/graph at the top of this page has the raw data shown in the graph. The dots (data) are shown in the graph and represent cases a day, total cases, and total deaths. I don't have all the exact details on the modeling. Dr. Frank does though. Please go follow Douglas G Frank on Facebook. There is much discussion and teaching (he's a teacher and as someone mentioned a few posts back, he teaches these same principles to geniuses in Ohio).

Several of his models are showing to be peaking in the next few days (TX above). Check them out. See if the modeling holds true.
 
Just an observation...

I’m seeing lots of graphs with no data or methods attached. Impossible to evaluate or draw any conclusions about models, etc. because figures alone don’t tell you anything. Posting results without the supporting data and methods is generally a red flag.

You can not evaluate a meal by looking at the parsley.

The original premise of the thread contained this flaw.
Those of us who have (and continue to) posted their personal observations and experiences are presenting the facts as we know them. Unless we are not telling the truth......
Disappointing that so many are desperate for info to the point that armchair experts' analyses are more comforting than real personal experience and knowledge.
Speaks volumes about many things - including how real and wide reaching this deal is.
In Montana, local govt's are implementing more stringent and concise restrictions than the Guv's plan(s). I have wrote him twice. Seems other's are doing the same.
I voted for him twice. As of right now - he's disappointing me.
My truth and experience.
Thinking this thread - if it continues or a facsimile pops up - will contain more "truth and experience" as things progress.
Health and sanity........

Great observation, HW.........
 
yesterday I mentioned DNR's being confused with not treating.

Today, hospitals are discussing and considering, not responding to a code blue patient who has the virus for two reasons

1. it takes doctors and nurses away from treating those who are not literally dying at that moment.

2. it adds additional risks to the doctors and nurses who attended to the code blue patients who have the virus

I do not know how to post links but I am sure there are fellows here who can find links to these new discussions among hospital staff and administrators, if there is an interest .
 
The original premise of the thread contained this flaw.
Those of us who have (and continue to) posted their personal observations and experiences are presenting the facts as we know them. Unless we are not telling the truth......
Disappointing that so many are desperate for info to the point that armchair experts' analyses are more comforting than real personal experience and knowledge.
Speaks volumes about many things - including how real and wide reaching this deal is.
In Montana, local govt's are implementing more stringent and concise restrictions than the Guv's plan(s). I have wrote him twice. Seems other's are doing the same.
I voted for him twice. As of right now - he's disappointing me.
My truth and experience.
Thinking this thread - if it continues or a facsimile pops up - will contain more "truth and experience" as things progress.
Health and sanity........

Great observation, HW.........

Singular experiences are anecdotal. They may be facts as you know them, but they are not reliable data that anyone should come to any conclusions based on. To have that you must have the either the entire data set, or a representative sample. This may give us a representative sample, but only after it plays out. Choosing not to look at other countries that are farther down our path is unwise. Why figure out how to work on your car, when you can open a book or YouTube and see what someone who already figured it out went through. Perhaps you can improve upon it, perhaps not, but it’s senseless to go in unprepared.

I don’t care what a graph says about where we will be in the future if it is based on data from the US. I would like to evaluate how dire this is by comparing Italy’s(as a worst case) current situation to past years. Until I can actually get that information. I have to say that I don’t know the answer.

Looking at Italy’s serious/critical cases, it does look like NY could face a ventilator shortage. BUT that is comparing NY to Italy. I would rather compare Italy to Italy, see how much worse it is than a really bad flu season, and then compare NY to NY.
 
In layman's terms, here is what you are looking at:


>
> “Feeling confused as to why Coronavirus is a bigger deal than Seasonal flu? Here it is in a nutshell. I hope this helps. Feel free to share this to others who don’t understand...
> It has to do with RNA sequencing.... I.e. genetics.
>
> Seasonal flu is an “all human virus”. The DNA/RNA chains that make up the virus are recognized by the human immune system. This means that your body has some immunity to it before it comes around each year... you get immunity two ways...through exposure to a virus, or by getting a flu shot.
>
> Novel viruses, come from animals.... the WHO tracks novel viruses in animals, (sometimes for years watching for mutations). Usually these viruses only transfer from animal to animal (pigs in the case of H1N1) (birds in the case of the Spanish flu). But once, one of these animal viruses mutates, and starts to transfer from animals to humans... then it’s a problem, Why? Because we have no natural or acquired immunity.. the RNA sequencing of the genes inside the virus isn’t human, and the human immune system doesn’t recognize it so, we can’t fight it off.
>
> Now.... sometimes, the mutation only allows transfer from animal to human, for years it’s only transmission is from an infected animal to a human before it finally mutates so that it can now transfer human to human... once that happens..we have a new contagion phase. And depending on the fashion of this new mutation, thats what decides how contagious, or how deadly it’s gonna be..
>
> H1N1 was deadly....but it did not mutate in a way that was as deadly as the Spanish flu. It’s RNA was slower to mutate and it attacked its host differently, too.
>
> Fast forward.
>
> Now, here comes this Coronavirus... it existed in animals only, for nobody knows how long...but one day, at an animal market, in Wuhan China, in December 2019, it mutated and made the jump from animal to people. At first, only animals could give it to a person... But here is the scary part.... in just TWO WEEKS it mutated again and gained the ability to jump from human to human. Scientists call this quick ability, “slippery”
>
> This Coronavirus, not being in any form a “human” virus (whereas we would all have some natural or acquired immunity). Took off like a rocket. And this was because, humans have no known immunity... doctors have no known medicines for it.
>
> And it just so happens that this particular mutated animal virus, changed itself in such a way the way that it causes great damage to human lungs..
>
> That’s why Coronavirus is different from seasonal flu, or H1N1 or any other type of influenza.... this one is slippery AF. And it’s a lung eater...And, it’s already mutated AGAIN, so that we now have two strains to deal with, strain s, and strain L....which makes it twice as hard to develop a vaccine.
>
> We really have no tools in our shed, with this. History has shown that fast and immediate closings of public places has helped in the past pandemics. Philadelphia and Baltimore were reluctant to close events in 1918 and they were the hardest hit in the US during the Spanish Flu.
>
> Factoid: Henry VIII stayed in his room and allowed no one near him, till the Black Plague passed...(honestly...I understand him so much better now). Just like us, he had no tools in his shed, except social isolation...
>
> And let me end by saying....right now it’s hitting older folks harder... but this genome is so slippery...if it mutates again (and it will). Who is to say, what it will do next.
>
> Be smart folks...
>
> #flattenthecurve. Stay home folks... and share this to those that just are not catching on.”

Here is the "corrected version" - I tried to follow the original text as closely as possible - so it is longer than necessary to provide the basic facts - but here it is:

----------

Feeling confused as to why Coronavirus is a bigger deal than typical common cold and flu? Here it is in a nutshell. I hope this helps. Feel free to share this to others who don’t understand.

Seasonal cold/flu symptoms are caused by over 150 different endemic viruses including rhinoviruses, corona viruses, RSV, parainfluenza and influenza. Casually people use “cold” and “flu” interchangeably to identify a set of symptoms such as fever, cough, congestion, sneezing and runny nose caused by these viruses. Absent hospitalization for advanced illness and resulting testing the actual specific virus type cause is rarely identified.

In a clinical sense, “flu” refers specifically to infections caused by the various influenza variants that are endemic. Clinically, the rest of the 150+ viruses cause the “common cold” (although at times RSV and parainfluenza can be harsh enough to result in specific treatment and identification). The reason influenza is called out separately in this discussion is because it can have more harmful symptoms and can cause death within susceptible populations (immunosuppressed/elderly/etc). Without a specific test there is essentially no way to distinguish between the common cold (caused by the 150+ viruses) and flu.

All of these are viruses are currently understood to infect humans, but some do cross over between species – influenza most notably. All the major causes of the common cold and influenza are RNA viruses – they do not have their own DNA. This feature is a significant reason for their ability to rapidly mutate – as there are not RNA repair mechanisms comparable to DNA repair mechanisms that suppress mutation. Once inside a human cell the virus produces unique viral proteins that can be recognized by the human immune system.

If you have already had a particular virus variant, you’re your body has some immunity to it before it comes around each year, but given the large number of virus variants and the rapid mutation rate of these RNA viruses there really is no permanent “immunity” from the common cold or influenza universally. As an aside, you get immunity two ways...through exposure to a particular virus, or in the case of influenza by getting a season-specific flu shot.

Novel (or New) viruses, arise from mutation of existing viruses. One frequently identified path is from viruses in animals that mutate sufficiently to cross over and infect humans as well. The WHO tracks novel viruses, including likely candidates found in animals, (sometimes for years watching for mutations). Usually these viruses only transfer from animal to animal (pigs in the case of H1N1) (birds in the case of the Spanish flu). But once in a while, one of these animal viruses mutates, and starts to transfer from animals to humans... then it’s a problem, Why? Because we have no natural or acquired immunity.

Sometimes, the mutation that allowed for transfer from animal to human only provides limited human to human transfer. In these situations additional mutation(s) are needed to provide effective transfer human to human. Once that happens, we have a new contagion that poses a risk. And depending on the results of these mutations, contagiousness or deadliness varies.

Fast forward.

Now, here comes this particular coronavirus. While coronaviruses of various types have existed in both animals and humans for centuries, a new variant arose. Early assessments suggest this particular coronavirus variant originally existed in animals only, for nobody knows how long. - and just recently mutated sufficiently to make the leap to being a human contagion. Some speculate this happened at an animal market, in Wuhan China, in December 2019

This Coronavirus, being new to humans, took off like a rocket. And this was because, Humans had not yet developed immunity. And given it’s newness and the very limited nature of known treatments for RNA viruses, doctors have no known medicines for it.

And it just so happens that this particular virus, causes great damage to human lungs in some patients.

This corona virus is not that different than other RNA viruses including influenza – the reason this pandemic is riskier is that there is no pre-existing human population immunity and it appears to be on the virulent side.

Also, all of these RNA viruses continue to mutate. Sometimes that results in lower lethality (as the virus can live longer in its hosts if it doesn’t kill them) and sometimes higher. Sometimes the mutations can change its immune signature, sometimes they don’t. We are still a long way from understanding the path this particular virus and its mutants will take.

Most people’s natural systems successfully fight off these types of viruses, but there are those, both healthy and ill, who do not. And basic care such as ventilators, anti-biotics to reduce secondary pneumonias, experimental anti-virals are all things modern medicine is trying to help the sickest. But in the meantime, history has shown that fast and immediate closings of public places has helped in the past pandemics. One commonly cited example - Philadelphia and Baltimore were reluctant to close events in 1918 and they were the hardest hit in the US during the Spanish Flu.

And let me end by saying....right now it’s hitting older folks harder... but this genome is so slippery...if it mutates again (and it will). Who is to say what it will do next, including possibly becoming less lethal and less transmissible – or more lethal or more transmissible – no body can possibly know at this time.

Be smart folks...

#flattenthecurve. Stay home folks... and share this to those that just are not catching on.
 
Last edited:
1585239482334.png

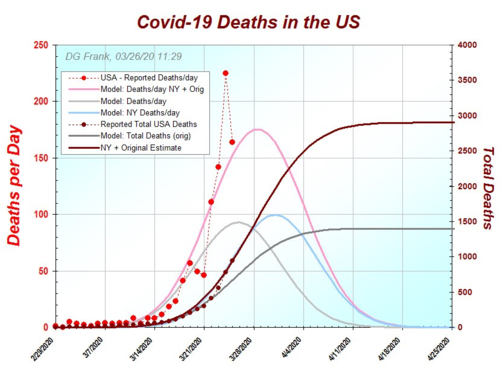
This is his most recent (this morning) US Projection. It includes US + NY. NY numbers are so different from other state's numbers that he is looking at them separately. This has been previously discussed and nothing is being hidden. Dr. Frank has been trying to decide how to most accurately model outlier, NY and the rest of the US at the same time. I'll post his model discussion below for everyone to read.

Covid-19 "USA Deaths Tracking with NY"

This graph is really revealing. And more importantly, it confirms an hypothesis we had a couple days ago.

I have changed nothing about any of the models. Think of this as merely "accounting." This is the first time I have ever looked at this plot, because I just made it. I've been stewing over the right way to do this for a couple days, and it was the first thought on my mind when I woke up. (The power of the subconscious mind...)

Let me walk you through it. I usually don't like putting so many traces on a single graph for public viewing. It scares people off. But it is worth it, trust me. Take your time, digest each plot. Look at the scale for it, and don't move on until you get it intuitively.

Let's start with the axes. The left vertical axis is for all "Deaths/day" curves, the right vertical axis is for the two "sigmoids," or total death curves that finish into it. (Near 1400 and 2900.)

Let's start with the red dashed plot with the red dots, USA Reported deaths per day. The scale for this is in red, on the left. It is real data, so it is noisy. But it is reality. (Always start with the DATA!!)

The pink shaded line that is tracking the red-dots-curve is the sum of my original projection for the whole USA (deaths/day) plus the model predictions for NY (deaths/day). This "sum of models" is closely tracking what we are **actually** observing. (It is the sum of the light gray and blue peaks.)

Next, the solid dark gray line is my original model death tally estimate for the whole country (finishing on the right, near 1400 total death tally). The light gray peak is the cases/day for that model (use left scale).

The light blue curve is the peak corresponding to the deaths/day predicted by our NY model.

When you add the original model to the NY model, you get the dark red plot, finishing just under 3,000 total deaths.

The dark red dots and dashed curve is the total reported death tally for the entire US (actual data). Note the "inflection point" in the curve corresponding to when the NY death peak starts growing and the trace begins diverging from my earlier estimate. (This is exactly what a "secondary infection looks like in other countries, eg Italy.)

I am not saying NY is a secondary infection. I'm saying, when you consider it separately *and* together, this approach tells you a lot about what is going on in our country.

I will update this graph every day for a while. I might simplify it too... but there is so much good information in here, I don't want to leave anything out. I will think on it.

What I love about this, is that we hypothesized a couple of days ago that this way of thinking about the country would match the data... AND IT DOES. An a priori hypothesis confirmed, making us more confident in our models. This is the scientific method.
 

A decent article that starting to look at some of the negative affects of the shut down.
It’s also pretty alarming how little people save for retirement.

edit: it’s nothing about robots the title of the article is; coronavirus shock is destroying Americans retirement dreams
 
View attachment 132952

How did you find out about this gentleman? Also do you know anything of his track record (for lack of a better term). Although I am work in natural resources my understanding of modeling is woefully thin. I have been trying to immerse myself with this type of information. Thanks for getting me started.
On a side note it seems that Imperial college is revising guidance from their early model.
 
Status
Not open for further replies.
Gastro Gnome - Eat Better Wherever

Latest posts

Forum statistics

Threads
111,224
Messages
1,951,601
Members
35,085
Latest member
dwaller4449
Back
Top