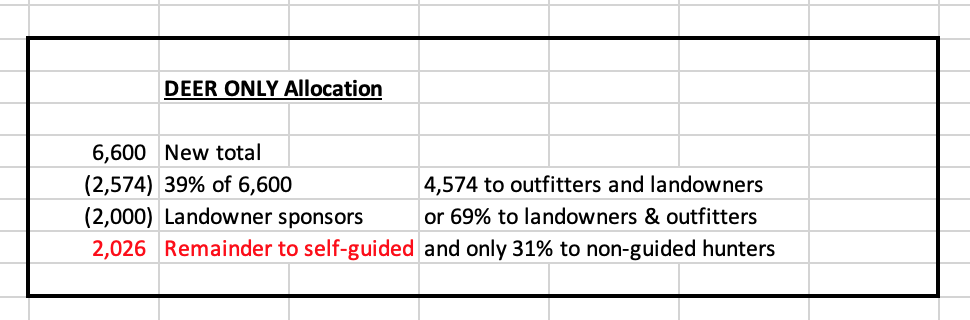
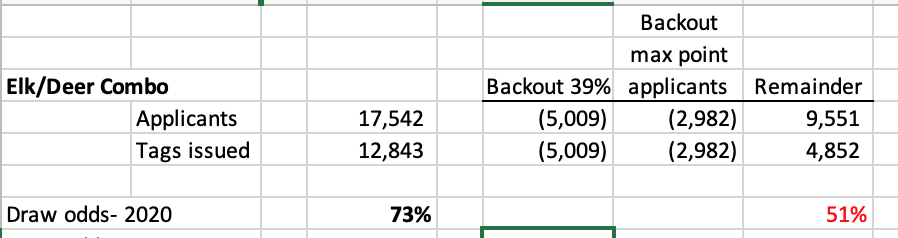
I have the numbers and analyzed them. It is bad for NRs that don't use an outfitter. Below is the analysis for non-resident deer under the proposed legislation.
View attachment 174008
Now look further into this, considering that 25% are given randomly, it is easiest to look at it as the entire application pool. In 2020 we had a lot of deer tags that were split off from the elk-deer combo, so we ended up with a total of 9,868 tags issued. There were 13,606 applicants, resulting in a 73% draw rate among all categories of deer licenses.
If we carve out 4,574 that will go to the outfitter and landowner pools, that leaves 9,032 applicants competing for the remaining 2,026 tags. Or, a 31% draw rate when all the other tags are allocated to the dedicated pools of applicants. Summary, the average DIY hunter, across all point levels, could be as low as a 31% draw rate if the total applicants were the same as 2020.
That is the point I am making to Mac in the podcast. This is not hard math. If one group of a population sample gets 100% draw odds, the remainder of that population sample gets much lower draw odds.
So, some folks get to hunt every year. The rest of the folks, assuming no increase in applicants, might get to draw every 3rd year. For anyone to argue against that basic level of math is laughable.
The same math principles apply for the ek-only and the elk-deer combo tags, just a function of how many people apply.