

Navigation
Install the app
How to install the app on iOS
Follow along with the video below to see how to install our site as a web app on your home screen.
Note: This feature may not be available in some browsers.
More options

You are using an out of date browser. It may not display this or other websites correctly.
You should upgrade or use an alternative browser.
You should upgrade or use an alternative browser.
Haters gonna hate!
- Thread starter Elkmagnet
- Start date
noharleyyet
Well-known member
Those belong to Jose...and don't you forget it.
Elkmagnet
Well-known member
Elkmagnet
Well-known member
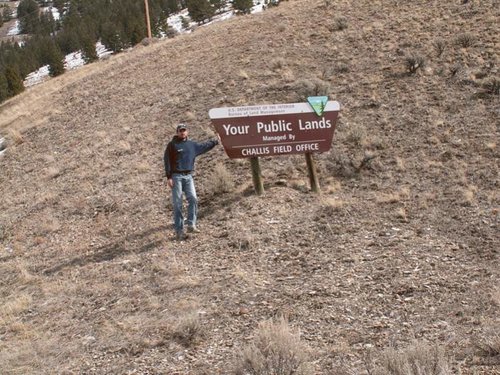
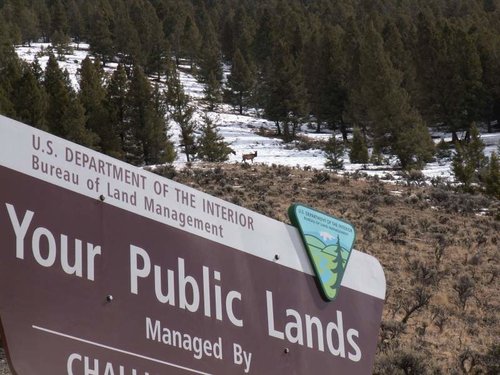
Ha! Sad part is the truth in that...Nice, Must be new, no evidence of target practice.

beretta303
New member
- Joined
- Aug 18, 2011
- Messages
- 5
Nice to see, i miss home. I grew up in Arco
Elkmagnet
Well-known member
Nice, Must be new, no evidence of target practice.
The sign is probably safe for the same reason the elk are probably safe....
.... there isn't enough room to get back and take a 1000 yard shot
One of Mitt Romney's campaign promises was to get the government out of the land business. If he had won you would see those signs replaced with something less inviting. I would hate to see closed signs go up on our public areas because the Republicans in Congress won't allow taxing the rich their fair share. And, I'd hate to be laid off of my Forest Service job because the budget is dried up for the same reason.
noharleyyet
Well-known member
Republicans in Congress won't allow taxing the rich their fair share.
You're serious, right? What is'their fair share'? Please enlighten me. You most likely swallow every ad hominem plattitude skeeter dishes.
Last edited:
I would hate to see closed signs go up on our public areas because the Republicans in Congress won't allow taxing the rich their fair share.
Really? The budget is dried up because the rich won't pay their fair share?

I can't believe those who just get by financially in life think it's the other people who are rich need to pay more tax than anyone else. This is the very reason many people in this country are getting lazy and don't work hard for anything. All working hard does is make you pay more taxes. Why not just sign up for financial aid, food stamps and any other form of government help. The rich guy over there will pay for it...until he no longer wants to work hard to support the lazy guy next door and decides to jump on the lazy train.
How long can the privately employed rich people in this country support paying everybody who is taking advantage of financial aid and those employed by the governement? Our system is out of whack! I'm working my ass off in hopes of becoming financially sound one day but sometimes I wonder why when a large portion of my check goes into a financial system that I don't believe in at the moment.
How long can the privately employed rich people in this country support paying everybody who is taking advantage of financial aid and those employed by the governement? Our system is out of whack! I'm working my ass off in hopes of becoming financially sound one day but sometimes I wonder why when a large portion of my check goes into a financial system that I don't believe in at the moment.
nidahunter
Well-known member
Couldnt have said it better!
noharleyyet
Well-known member
.The top 10 percent of taxpayers paid over 70% of the total amount collected in federal income taxes in 2010, the latest year figures are available, according to the Tax Foundation, a think tank that advocates for lower taxes. That's up from 55% in 1986.
The remaining 90% bore just under 30% of the tax burden. And 47% of all Americans pay hardly anything at all -- a fact that got Republican presidential candidate Mitt Romney into political hot water last year
http://money.cnn.com/2013/03/12/news/economy/rich-taxes/index.html
So what's fair share...80%....90?
smarandr
Well-known member
The only thing worse than paying taxes is not paying taxes.
jryoung
Well-known member
.
The top 10 percent of taxpayers paid over 70% of the total amount collected in federal income taxes in 2010, the latest year figures are available, according to the Tax Foundation, a think tank that advocates for lower taxes. That's up from 55% in 1986.
The remaining 90% bore just under 30% of the tax burden. And 47% of all Americans pay hardly anything at all -- a fact that got Republican presidential candidate Mitt Romney into political hot water last year
So what's fair share...80%....90?
There needs to be some context in that though, in 1986 there was far less disparity between incomes of the top, middle and bottom feeders. So as the wages of the 10% have far outpaced the increases of the middle class it's natural their portion of taxes increase.
Real wages have remained flat for the last 30 years.
dustinf
Active member
From:
http://en.m.wikipedia.org/wiki/Distribution_of_wealth#In_the_United_States
http://en.m.wikipedia.org/wiki/Distribution_of_wealth#In_the_United_States
According to the Congressional Budget Office, between 1979 and 2007 incomes of the top 1% of Americans grew by an average of 275%. During the same time period, the 60% of Americans in the middle of the income scale saw their income rise by 40%. Since 1979 the average pre-tax income for the bottom 90% of households has decreased by $900, while that of the top 1% increased by over $700,000, as federal taxation became less progressive. From 1992-2007 the top 400 income earners in the U.S. saw their income increase 392% and their average tax rate reduced by 37%.[18] In 2009, the average income of the top 1% was $960,000 with a minimum income of $343,927.[19][20][21]
In 2007 the richest 1% of the American population owned 34.6% of the country's total wealth, and the next 19% owned 50.5%. The top 20% of Americans owned 85% of the country's wealth and the bottom 80% of the population owned 15%. From 1922 to 2010, the share of the top 1% varied from 19.7% to 44.2%, the big drop being associated with the drop in the stock market in the late 1970's. Ignoring the period where the stock market was depressed (1976-1980) and the the period when the stock market was overvalued (1929), the share of wealth of the richest 1% remained extremely stable, at about a third of the total wealth. [22] Financial inequality was greater than inequality in total wealth, with the top 1% of the population owning 42.7%, the next 19% of Americans owning 50.3%, and the bottom 80% owning 7%.[23] However, after the Great Recession which started in 2007, the share of total wealth owned by the top 1% of the population grew from 34.6% to 37.1%, and that owned by the top 20% of Americans grew from 85% to 87.7%. The Great Recession also caused a drop of 36.1% in median household wealth but a drop of only 11.1% for the top 1%, further widening the gap between the 1% and the 99%.[23][24][22] During the economic expansion between 2002 and 2007, the income of the top 1% grew 10 times faster than the income of the bottom 90%. In this period 66% of total income gains went to the 1%, who in 2007 had a larger share of total income than at any time since 1928.
Similar threads
- Locked
- Replies
- 196
- Views
- 10K
- Replies
- 42
- Views
- 2K