It would be easier to tell if you had used a ruler and had correlating data
Here is a suggestion how about dropping the little snide arrogance and have a simple discussion where we directly ask and answer courteous questions
Follow along with the video below to see how to install our site as a web app on your home screen.
Note: This feature may not be available in some browsers.
It would be easier to tell if you had used a ruler and had correlating data
How are the data not correlating?It would be easier to tell if you had used a ruler and had correlating data
Here is a suggestion how about dropping the little snide arrogance and have a simple discussion where we directly ask and answer courteous questions
Thanks to you as well for pointing out this is not a Mt specific threadThere are many folks from North Dakota on this site. Many of which participate and share stories of their hunting/fishing adventures, discuss tactics and stay up on all aspects related to conservation. I've made friends through this forum. The forum boss here runs a tight ship. I'm sure Vollmer is a nice guy but he doesn't do the level of moderation that is occurs here, therefore many of us prefer to hang out here.
You and @DGND like to make statements hoping to get a reaction from people so you can copy and paste it to another board to disparage guys like Brock and organizations like BHA. Facts don't really matter to you. I've seen you operate for enough years to know that's how you guys work.
I do love how BHA lives rent free in your and Dwight's heads.
Maybe you should do your own research.
Thanks to you as well for pointing out this is not a Mt specific thread
This is a public forum discussing a public issue in our state legislature being debated that will take away a hunting tool from thousands of people or return it through a vote
Sharing public information or statements in that debate is hardly something wrong
Its the internetif you don’t want your comments or claims copied and pasted …on an issue being debated … don’t make them
Well on the “ time” side graph we have no idea if it is days or decades and we have no idea of what “ prevalence” you are speaking ofHow are the data not correlating?
Aha. I see what you did there.Where are you getting 7.9%? That prevalence is reported in nothing that you’ve posted that I can see.
no effort to be cute at all. The only tool I had at my disposal at the moment. Sorry it offended you. But it is accurately illustrating my point.Well on the “ time” side graph we have no idea if it is days or decades and we have no idea of what “ prevalence” you are speaking of
I know it was an effort to be cute and all with the crayons but lets stick to actual data from here in ND and perhaps you could answer those 6 questions I posed regarding the two units
And then perhaps answer how many deer have been found dead in thecwild in the last 12 years in ND with CWD ?
It’s pointless cuz your looking at this through one lense - yoursAha. I see what you did there.
You do realize those are rates, and you can’t just add those together, right?
no effort to be cute at all. The only tool I had at my disposal at the moment. Sorry it offended you. But it is accurately illustrating my point.
When you boys figure out how to do the math correctly, maybe we can have an actual discussion. Otherwise this is clearly pointless.
Well perhaps doing the math correctly is combining all positives of both mule deer and white tail deerAha. I see what you did there.
You do realize those are rates, and you can’t just add those together, right?
no effort to be cute at all. The only tool I had at my disposal at the moment. Sorry it offended you. But it is accurately illustrating my point.
When you boys figure out how to do the math correctly, maybe we can have an actual discussion. Otherwise this is clearly pointless.
I wasn't planning on ever typing on this site, until:You are full of crap! I have never owned or been a moderator of any website or forum in my life. Try again, Dwight.
I watched your testimony to the House ENR committee. Not only do I not run a website I also don't work for the federal government or work to funnel federal dollars to BHA. Your tinfoil hat is on WAY too tight.
Yes. The lens of math is super subjectiveIt’s pointless cuz your looking at this through one lense - yours
Where are you getting 7.9%? That prevalence is reported in nothing that you’ve posted that I can see


Yes. The lens of math is super subjectivehow many tests were done in 3f2
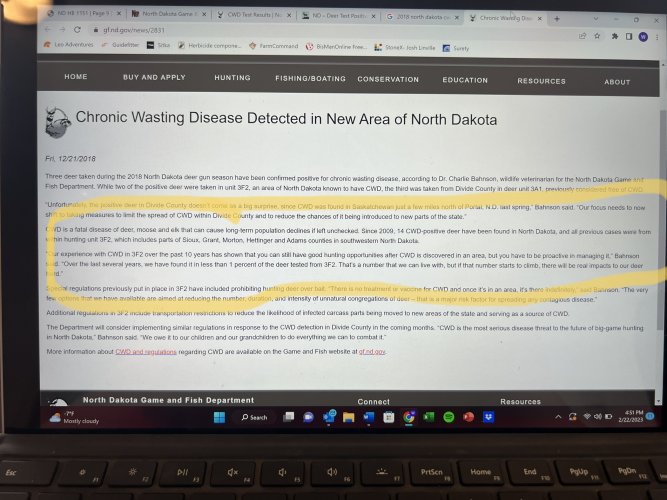
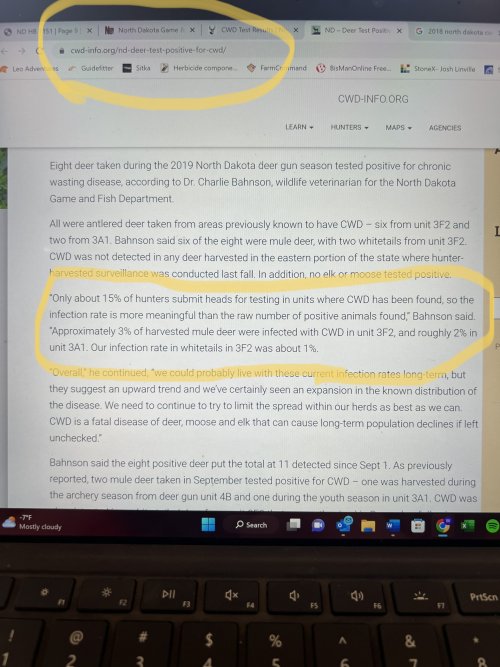
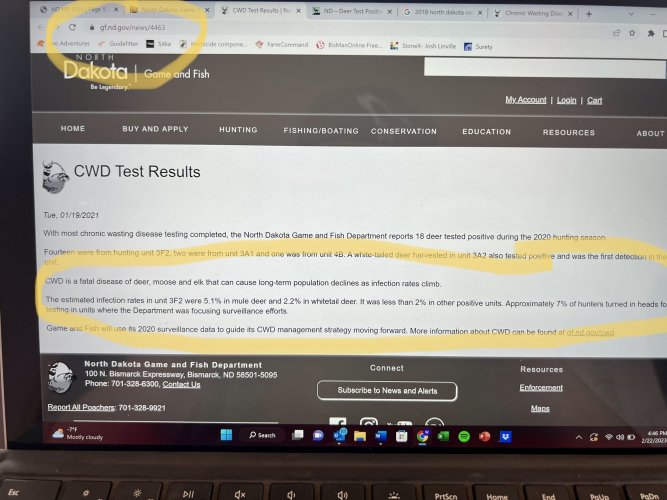
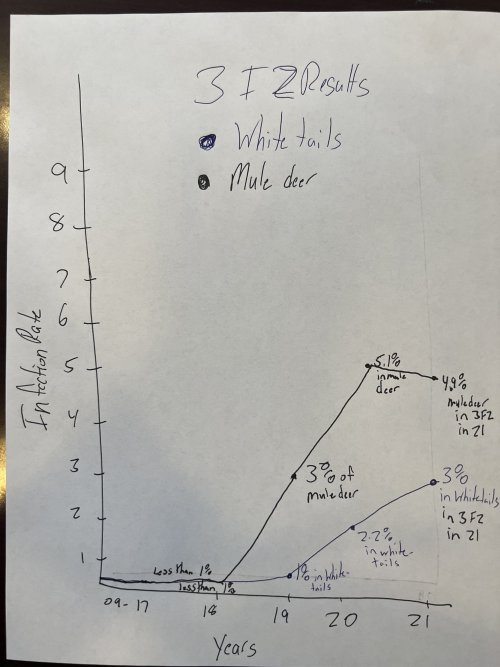
Those are pictures from the links I sent with the infection rates highlighted.. I didn't include a 2018 link becuase it was below 1%. The rest show infection rate of white tails and mule deer and break it down to each in 3f2. I added those together to get the numbers I posted.
Yep yep. I did fast head math and goofed up. Give me a second to get my new graph uploadedIf I'm interpreting the reports correctly, your math doesn't make sense. Here's an imaginary situation with similar math- If 98% of republicans in North Dakota are Caucasian and 95% of Democrats in North Dakota are Caucasian, does that mean 193% of major political party affiliated North Dakotans are Caucasian?
Aha. I see what you did there.
You do realize those are rates, and you can’t just add those together, right?
no effort to be cute at all. The only tool I had at my disposal at the moment. Sorry it offended you. But it is accurately illustrating my point.
When you boys figure out how to do the math correctly, maybe we can have an actual discussion. Otherwise this is clearly pointless.

She never mentions 3a1 in the post about the graph.. But if she was her 3a1 line would have to jump from 0 to less than 2% to 6.9% in mule deer only over a 3 year period (again, mule deer frequency at bait piles is much lower then whitetails, plus for the years of the big spikes baiting restrictions were already in place).I'm guessing @Hunting Wife's graph was contrasting prevalence trend in 3A1 vs 3F2, can ya help is with one of those graphs too?
Where is @wllm when you need him anyway?
I meant on the topic in general not mathYes. The lens of math is super subjective
Yes, my crappy illustration was attempting to compare the two units. Apologies again, the only tool I had at the time. It’s more just a trend line to show the rate differences, not really a graph.She never mentions 3a1 in the post about the graph.. But if she was her 3a1 line would have to jump from 0 to less than 2% to 6.9% in mule deer only over a 3 year period (again, mule deer frequency at bait piles is much lower then whitetails, plus for the years of the big spikes baiting restrictions were already in place).