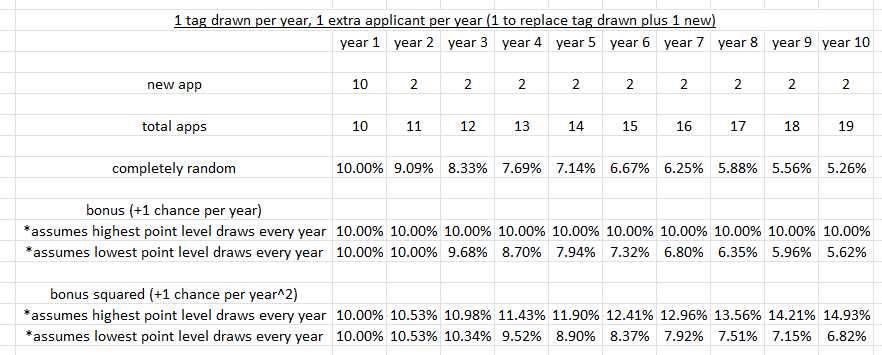
Some of you really seem to struggle with math. Here is a spreadsheet that might help clear a few things up on the bonus points. It certainly helps your draw odds to have more points and even better at max. I took all the Moose districts in Montana and combined all the drawing by points. I only looked at either sex tags and residents. While I don't include non-residents, to show my point it is not needed, it just complicates things.
| Number of Points | Number of Applications | Number of Successes | % Successful |
0 | 2864 | 0 | 0.0% |
1 | 3692 | 0 | 0.0% |
2 | 3363 | 1 | 0.0% |
3 | 2996 | 4 | 0.1% |
4 | 2555 | 3 | 0.1% |
5 | 2287 | 3 | 0.1% |
6 | 1898 | 12 | 0.6% |
7 | 1688 | 5 | 0.3% |
8 | 1506 | 7 | 0.5% |
9 | 1337 | 8 | 0.6% |
10 | 1119 | 7 | 0.6% |
11 | 1038 | 8 | 0.8% |
12 | 984 | 14 | 1.4% |
13 | 608 | 3 | 0.5% |
14 | 553 | 10 | 1.8% |
15 | 519 | 9 | 1.7% |
16 | 494 | 7 | 1.4% |
17 | 482 | 7 | 1.5% |
18 | 427 | 8 | 1.9% |
19 | 402 | 18 | 4.5% |
20 | 383 | 15 | 3.9% |
21 | 380 | 14 | 3.7% |
22 | 374 | 16 | 4.3% |
23 | 370 | 10 | 2.7% |
24 | 465 | 19 | 4.1% |
25 | 490 | 23 | 4.7% |
This was for the 2025 draw. Stats for 2026 aren't out as of yet. This shows the number of people with each amount of points, how many were successful and the percent at each bonus point level. As you can see the best odds were at max points (4.7%) last year. I am sure some will point out that certain number of points had higher odds even though they had less points, such as 19 points had 4.5% chance of drawing and 23 points only had 2.7%. This is the random part of this drawing coming through since these percents are what ACTUALLY happened in the draw. Using statistical theory you can calculate the odds of each person, but in practice that doesn't happen every time. Think about it this way, if you flip a coin 4 times you know it should come up heads twice and tails twice by theory, but that doesn't always happen in practice....this is the random part.








 .
.