Montana Drawing Statistics Data Question

I do not that is definitely an issue I have struggled with though, I've also run into how to account for people dropping out of the system when they draw.

So for instance, I know I won't draw 680-20 in any given year with minuscule odds, but what are my total odds of drawing it in my lifetime if I put in every year for 30 years and each year buy a bonus point.
Depends on lots of factors, the most important when you started applying, how many are in the pool ahead of you, how many are entering the drawing behind you, how many drop out of the draw each year, and also how many tags they continue to issue.

But, the number of years you apply, really doesn't matter that much as each year is an independent draw with different variables from year to year. (more tags, less tags, more applicants, less applicants, etc.)
 
But, the number of years you apply, really doesn't matter that much as each year is an independent draw with different variables from year to year. (more tags, less tags, more applicants, less applicants, etc.)
Sure though your odds improve each time you participate in a contest.

If a draw is 1% each year and you apply for 10 years, your odds of drawing improve to 9.55% of drawing a tag. If for 9 years you don't draw you don't have 9.55% odds suddenly on year 10, but rather looking at the situation collectively.

My thinking is more considering, if I do this for my life will I even have somewhat of a chance. Lifetime odds of 25% are different than lifetime odds of 1%.
 
How much money do those Bighorn bonus points generate? Only a small fraction of them are ever used.

In a way, the bonus point system is good system. There is a minor element of randomness or "getting lucky", but overall it still favors those who've been applying longer, and it generates a metric shit ton of money for management.
Sure, but $75-$150 non-refundable application fees and a random system also generate a lot of money as well.

It also comes with a lot less entitlement and problems with people feeling like they have "bought" something via a point sale. You get nice consequences with point systems, like dear old grandpa wanting to "will" his points to his grandson since, "he bought them". The WY bill this year to allow points to be shared among family members, etc.

Point systems come with baggage...
 
I've tried to build accurate draw odds spreadsheets before and always run into the same problem. The odds for the first tag drawn are straightforward, but what about the second? Your odds of drawing the second tag depend on how many bonus points that first guy had as all his points are now removed from the pool. If he had 1 point no big change, but what if he had 20^2?

In some cases with many applicants (MT resident bighorn for example) it doesn't end up mattering that much, but other draws with smaller numbers of applicants and squared or cubed points (ND nonresident Badlands mule deer) are impacted in a big way.

Anyone know how to properly account for that?

Oof, I didn't take in account that the odds change once a tag is drawn and that person and their XX^2 points are out of the pool.

I do not that is definitely an issue I have struggled with though, I've also run into how to account for people dropping out of the system when they draw.

So for instance, I know I won't draw 680-20 in any given year with minuscule odds, but what are my total odds of drawing it in my lifetime if I put in every year for 30 years and each year buy a bonus point.

680-20 is actually the unit whose data I was messing with last night!
 
Correct, and it happens a majority of the time and as time goes on, and applications for sheep, moose, goat increase...the max point holders have diluted odds.

The bonus point systems favor higher point pools in the first few years...over time, that simply isnt true. Look at the number of applicants in each point pool for sheep in Montana. The max point pool of applicants is dwarfed by those with 1-20 points.

I think what a lot of the disconnect on odds is that there's a big difference between how bonus points impact a draw with 2,000 tags, 4,000 applicants a year, and large parts of the point pools clearing each year.

Its a whole different deal when you have 10,000 applicants with 2 available tags and you're 21-22 years into a bonus system. Your squared max points mean less and less over time, in particular when the point pools and total applicants behind you are increasing each year.

As an example....if you're the lone max bonus point holder with 20...square them, 400 names in the hat. Then you have 100 guys with 19 and they square their points, and another 100 with 18...square those, and another 100 with 17, square those...all the way down to 1.

The odds are infinitely more likely that the 2 tags are going to be drawn by the guys in the 1-19 squared pool than the lone guy with 400 chances in the hat.

That's what is going on with hard to draw tags in NV and MT with squared bonus point systems...so many new applicants entering the draws that its diluting the top point pools. The lower applicant pools outnumber the top point pools, both in applicants and "squared chances", by huge amounts.

Another way to look at it (a unit with 1 available sheep tag), a lone applicant with 10 points squared, has 100 chances in the hat. Which is 100 times better odds than any single applicant with only one chance in the hat. But, if there are 1000 one point applicants...that pool of 1 point applicants has a 90% probability that one of them is drawing that single tag. There's also a 90% chance that Mr. 10 bonus point squared guy is going to have 11 points, no tag, and looking at pictures of a ram a 1 point holder shot.
I think it is relevant that if you look at a typical point pool there is a pyramid of applicants (most at bottom and thinning toward top). If there were 100 people with each number of points like you mentioned as an example above, points squared has an advantage over flat points for high point holders but not as significantly.

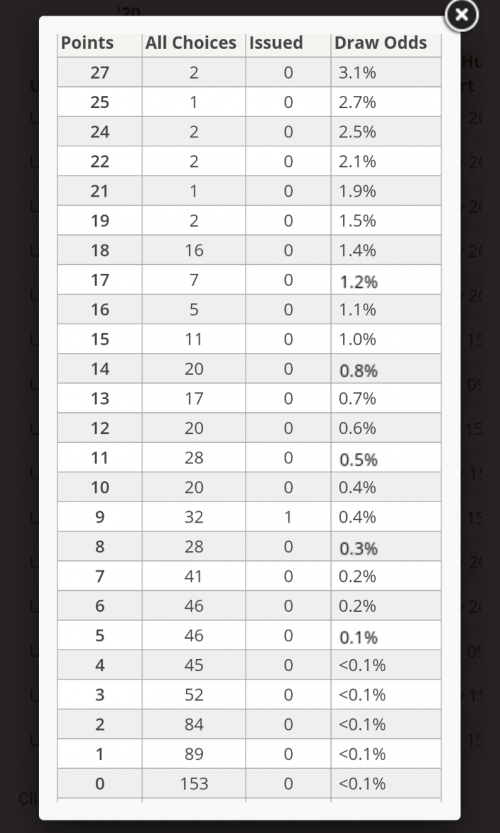
I attached odds for a Nevada desert sheep unit last year as an example. When you look at spreads like this generally they have the same pattern....more people on bottom, fewer on top. This is where bonus squared shines for top end point holders.

The two top point holders have 730 chances each to draw. So in this example, each of the two 27 point holders has virtually equal chance of drawing as the probability of one person drawing with 0,1, or 2 points (326 people with a total of 751 chances). In a flat bonus points scenario for that same group of applicants, the tag being drawn by one of those 326 people are 12 times more likely to draw than someone sitting at 27 flat points.

With increases in applicants each year and a point structure that has more at the bottom and fewer at the top, squaring points significantly helps keep the people in the top tiers with higher probability...in short, their time and money invested in the draw systems with points squared is more valuable than if it were flat points.

If high point holders in bonus squared situations think that getting a tag is an eventuality like a preference system because they are on top, they are mistaken. But, their odds will be better than others and each year that they stick with it helps keep them in a better spot than those below.

But more importantly, everyone has pretty crappy odds of a sheep tag.

Screenshot_20210416-090446.png
 
My thinking is more considering, if I do this for my life will I even have somewhat of a chance. Lifetime odds of 25% are different than lifetime odds of 1%.
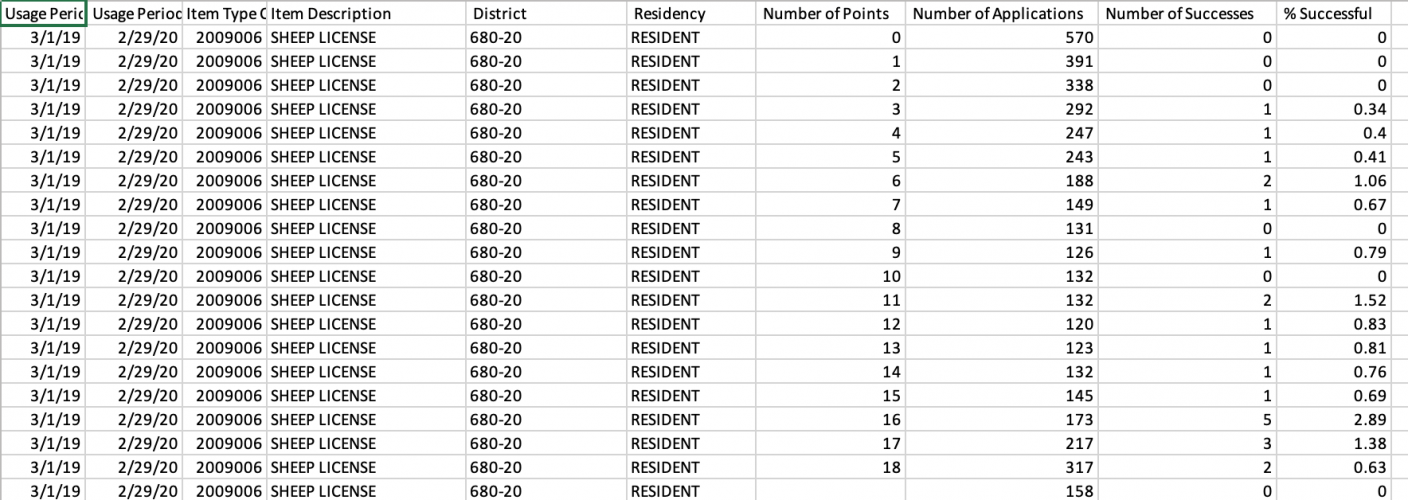
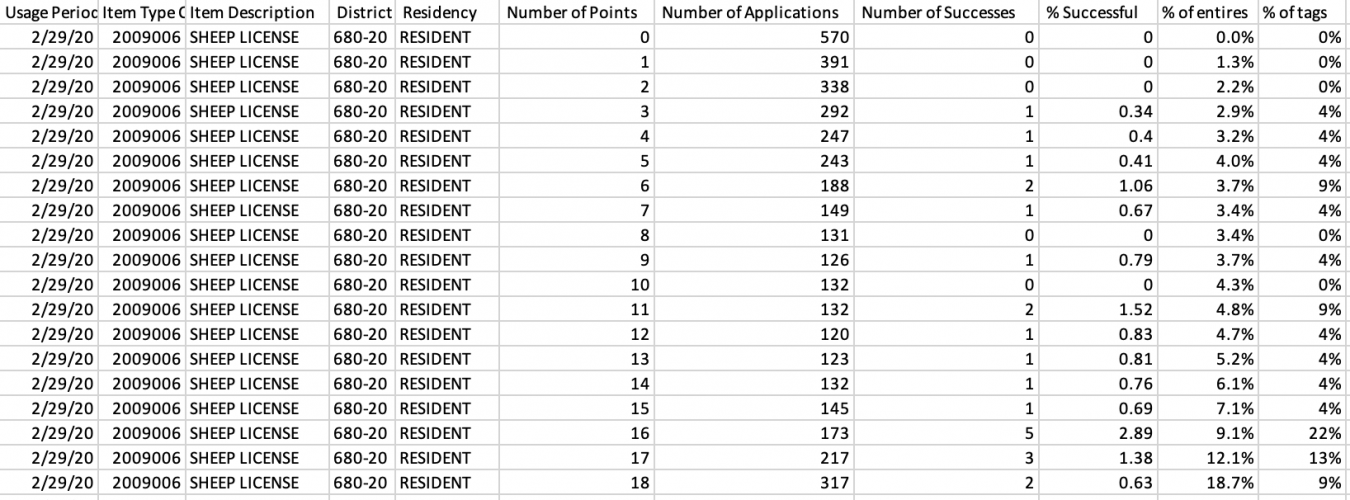
Statistically speaking, it doesn't look good. For a NR especially. But there is always a chance, so it depends how lucky you are. Here is the 2019 Resident draw for 680 sheep. Six people with less than 8pts drew. Luck SOBs. There were 2 NR tags. one draw by max point holder (18) and one by someone with 13.
Screen Shot 2021-04-16 at 9.54.51 AM.png

Everything had already been pointed out. Great discussion. Someone asked if the odds could ever go from 60% to 0% or 100%. The technical answer is yes, but... Your odds can only be 100% if the number of tags is equal to or greater than the number of applicants and the odds can never be 0%. Numbers can change from year to year, but it would take a catastrophic event to the # of applicants or the # of tags to get the extremes. Generally, the past years point distribution is the best guess of what next year will look like. I have seen the odds change by almost 5% or more though. The more tags there are, the more the distribution will look like the statistical prediction.
 
I think it is relevant that if you look at a typical point pool there is a pyramid of applicants (most at bottom and thinning toward top). If there were 100 people with each number of points like you mentioned as an example above, points squared has an advantage over flat points for high point holders but not as significantly.

I attached odds for a Nevada desert sheep unit last year as an example. When you look at spreads like this generally they have the same pattern....more people on bottom, fewer on top. This is where bonus squared shines for top end point holders.

The two top point holders have 730 chances each to draw. So in this example, each of the two 27 point holders has virtually equal chance of drawing as the probability of one person drawing with 0,1, or 2 points (326 people with a total of 751 chances). In a flat bonus points scenario for that same group of applicants, the tag being drawn by one of those 326 people are 12 times more likely to draw than someone sitting at 27 flat points.

With increases in applicants each year and a point structure that has more at the bottom and fewer at the top, squaring points significantly helps keep the people in the top tiers with higher probability...in short, their time and money invested in the draw systems with points squared is more valuable than if it were flat points.

If high point holders in bonus squared situations think that getting a tag is an eventuality like a preference system because they are on top, they are mistaken. But, their odds will be better than others and each year that they stick with it helps keep them in a better spot than those below.

But more importantly, everyone has pretty crappy odds of a sheep tag.

View attachment 180692
...and look where the tag fell.

The top point holders are outnumbered by a huge margin.

The top point holders do have a leg up on an INDIVIDUAL applicants below them, but not when competing against several hundred of them as a group.

Yes, sheep odds suck and squaring bonus points does give a person a very tiny edge...I would argue almost statistically irrelevant its so small. Probably not significant enough to lay down a couple hundred clams a year to "improve" your odds buying a point.

I view point purchasing as not improving my odds, but just making sure that my odds don't get any worse.
I agree that often your odds do not increase once you are established with some points...because you're right....so many new people and so few drawing, ageing out or quitting. They can help you stay ahead of whatever pack of people is under you.
 
Statistically speaking, it doesn't look good. For a NR especially. But there is always a chance, so it depends how lucky you are. Here is the 2019 Resident draw for 680 sheep. Six people with less than 8pts drew. Luck SOBs. There were 2 NR tags. one draw by max point holder (18) and one by someone with 13.
View attachment 180697

Everything had already been pointed out. Great discussion. Someone asked if the odds could ever go from 60% to 0% or 100%. The technical answer is yes, but... Your odds can only be 100% if the number of tags is equal to or greater than the number of applicants and the odds can never be 0%. Numbers can change from year to year, but it would take a catastrophic event to the # of applicants or the # of tags to get the extremes. Generally, the past years point distribution is the best guess of what next year will look like. I have seen the odds change by almost 5% or more though. The more tags there are, the more the distribution will look like the statistical prediction.
The distribution of which point levels got tags in the previous year is completely irrelevant in calculating odds for the current year. The only things that matter in that calculation are total number of tags issued and total number of applicants at each point level. And then you make an assumption that none of those variable from the previous year will drastically change in the current year when calculating your odds. You could adjust that assumption to take into account the previous year draw successes and remove those from the pool, but so long as your have a large number of applicants it won’t change the end result much.
 
The distribution of which point levels got tags in the previous year is completely irrelevant in calculating odds for the current year. The only things that matter in that calculation are total number of tags issued and total number of applicants at each point level. And then you make an assumption that none of those variable from the previous year will drastically change in the current year when calculating your odds. You could adjust that assumption to take into account the previous year draw successes and remove those from the pool, but so long as your have a large number of applicants it won’t change the end result much.
Correct. Generally speaking, i.e. with a large enough pool, the calculation shouldn't change much from y-y. There will be changes though, mostly from more people joining the pool (as Buzz pointed out). Over time these changes can be significant. Death by a thousand applicants.
 
The larger the disparity between tags available and tag applicants = less the previous years draw stats mean anything

The larger the number of tags available and the closer the two come together = the more previous years stats provide insight.


But even in SAJs post above with the table. The bottom half of that table (high point holders) account for the most tags drawn, as expected. So this data is somewhat relevant for the following drawing, it allows us to see approx number of applicants and concentration of points. But again, MT 680 sheep is right on that line where it doesn't provide any "real" insight as to when you can expect to draw because its so damn hard to draw no matter how many points you have.

But that distribution should play out like that most years (well until or unless the small point holders completely overtake the draw). Again, the fewer tags drawn(smaller sampling size) the less the previous year means anything. If you were to change the total number of Big horn tags available in that table to say 5 total tags....there would be almost no recognizable pattern from year to year, making the previous years data irrelevant. You'd likely need decades worth of draw stats to see any type of trend. This is exactly what's like looking at Nevada draw statistics. You look at a unit that gives out 10 tags every year and it's almost like bonus points mean nothing.

Look at one of the 600 series elk archery permits where there's thousand(s) of tags given out every year and the bonus points offer a very clear picture of when you should expect to draw. The previous year(s) stats are insanely enlightening.
 
Last edited:
I view point purchasing as not improving my odds, but just making sure that my odds don't get any worse.
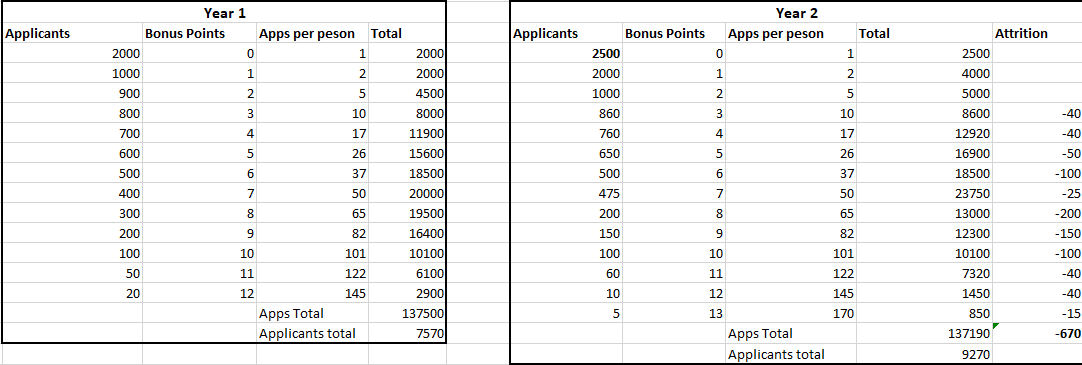
I think that is probably a good way to look at it... though bonus points makes attrition interesting. People leaving at higher levels have an exponentially greater effect.

Example, in year 2 you have 2500 new applicants for a tag, 670 people draw/stop applying/die/ etc.

MFWP reports Sheep apps up 22%!!!, everyone loses their shit about NR, we cry, a couple people start therapy, 5 guys from WY join only to get banned in 5 hrs.

But...

Odds actually got better.

Point is a 1 dude with 20 points throwing in the towel is worth 400 first time applicants.

All that being said... I'm still not drawing a sheep tag in my lifetime so what does it really matter. 🤷‍♂️

1618595766160.png
 
Boy this has been interesting. So at this point we can just all agree any point scheme just sucks and is only a money grab and that all States should just be random draws... That's my opinion and I'm sticking to it! As a matter of fact they should all follow Idaho's lead.
 
The larger the disparity between tags available and tag applicants = less the previous years draw stats mean anything

The larger the number of tags available and the closer the two come together = the more previous years stats provide insight.


But even in SAJs post above with the table. The bottom half of that table (high point holders) account for the most tags drawn, as expected. So this data is somewhat relevant for the following drawing, it allows us to see approx number of applicants and concentration of points. But again, MT 680 sheep is right on that line where it doesn't provide any "real" insight as to when you can expect to draw because its so damn hard to draw no matter how many points you have.

But that distribution should play out like that most years (well until or unless the small point holders completely overtake the draw). Again, the fewer tags drawn(smaller sampling size) the less the previous year means anything. If you were to change the total number of Big horn tags available in that table to say 5 total tags....there would be almost no recognizable pattern from year to year, making the previous years data irrelevant. You'd likely need decades worth of draw stats to see any type of trend. This is exactly what's like looking at Nevada draw statistics. You look at a unit that gives out 10 tags every year and it's almost like bonus points mean nothing.

Look at one of the 600 series elk archery permits where there's thousand(s) of tags given out every year and the bonus points offer a very clear picture of when you should expect to draw. The previous year(s) stats are insanely enlightening.
One of the main principles of statistics is that past results have no effect on the outcome of a new draw. Each draw is an individual event with each point level have a certain probability to be drawn. The statistics are there and they do affect each individual draw for a tag but no matter how many times in a row a coin flip ended with heads up the next flip is still 50/50 chance.
 
One of the main principles of statistics is that past results have no effect on the outcome of a new draw. Each draw is an individual event with each point level have a certain probability to be drawn. The statistics are there and they do affect each individual draw for a tag but no matter how many times in a row a coin flip ended with heads up the next flip is still 50/50 chance.
Absolutely. Next year everyone could stop applying altogether.

But there's a human element that these points affect, and its predictable. If everything was a completely random draw, I might not get so attached to applying in a certain unit. I might just apply wherever. A buddy might say, "hey, let's apply here this year"....I have nothing to lose because I have no points invested and next year I'll be in the same position I am this year. I won't do that in the MT draw. I target a unit and keep my points with the intention of drawing that unit, and I know that historical data tells me X points should get me that tag. I'm not going to go rogue and apply for a different unit with a buddy just because....If I draw it I could lose all my points and then have to start over on the unit I originally wanted to hunt.

The human element makes almost all the historical data a contributing factor into the next years draw. I've noticed units where it seems like after X amount of points applicants will switch units. They'll give up 80% odds for one unit for 60% for what they think is a better unit. That whole decision is based on the previous years draw stats.
 
The larger the disparity between tags available and tag applicants = less the previous years draw stats mean anything

The larger the number of tags available and the closer the two come together = the more previous years stats provide insight.


But even in SAJs post above with the table. The bottom half of that table (high point holders) account for the most tags drawn, as expected. So this data is somewhat relevant for the following drawing, it allows us to see approx number of applicants and concentration of points. But again, MT 680 sheep is right on that line where it doesn't provide any "real" insight as to when you can expect to draw because its so damn hard to draw no matter how many points you have.

But that distribution should play out like that most years (well until or unless the small point holders completely overtake the draw). Again, the fewer tags drawn(smaller sampling size) the less the previous year means anything. If you were to change the total number of Big horn tags available in that table to say 5 total tags....there would be almost no recognizable pattern from year to year, making the previous years data irrelevant. You'd likely need decades worth of draw stats to see any type of trend. This is exactly what's like looking at Nevada draw statistics. You look at a unit that gives out 10 tags every year and it's almost like bonus points mean nothing.

Look at one of the 600 series elk archery permits where there's thousand(s) of tags given out every year and the bonus points offer a very clear picture of when you should expect to draw. The previous year(s) stats are insanely enlightening.
I added a couple of columns- % of Pts/entires and % of tags. There is some randomness to the result - which we expect and are all hoping for. The 6pt group drew at a 16pt level. Max pts took half the tags we would have expected.

Screen Shot 2021-04-16 at 12.25.28 PM.png
 
One of the main principles of statistics is that past results have no effect on the outcome of a new draw. Each draw is an individual event with each point level have a certain probability to be drawn. The statistics are there and they do affect each individual draw for a tag but no matter how many times in a row a coin flip ended with heads up the next flip is still 50/50 chance.
We have mounds of data that tells us last years draw stats matter to hunters. They base their application decisions on that information. So the past results nearly always influence that years draws.

well, except for sheep tags and super hard to draw tags. They may as well be completely random, but since they aren't I guarantee if given the choice everyone would choose to have more bonus points than less.
 
Yeti GOBOX Collection

Latest posts

Forum statistics

Threads
111,035
Messages
1,944,423
Members
34,976
Latest member
atlasbranch
Back
Top