Leupold BX-4 Rangefinding Binoculars

Do Colorado weighted points make a difference?

Oak

Expert
Joined
Dec 23, 2000
Messages
15,907
Location
Colorado
Who knows?! Haha. But I channeled my inner @wllm1313 and set out to see if I could decide for myself.

I chose to look at resident moose statistics for a couple of reasons. First, the volume of applications would smooth out the chance of variability you might see from lower volume NR apps.

Second, it's the hardest species for residents to draw in the state, and the 2021 hunt recap seemed to cause a lot of angst when it showed how many low point holders drew licenses. Let's take a look at the recap:
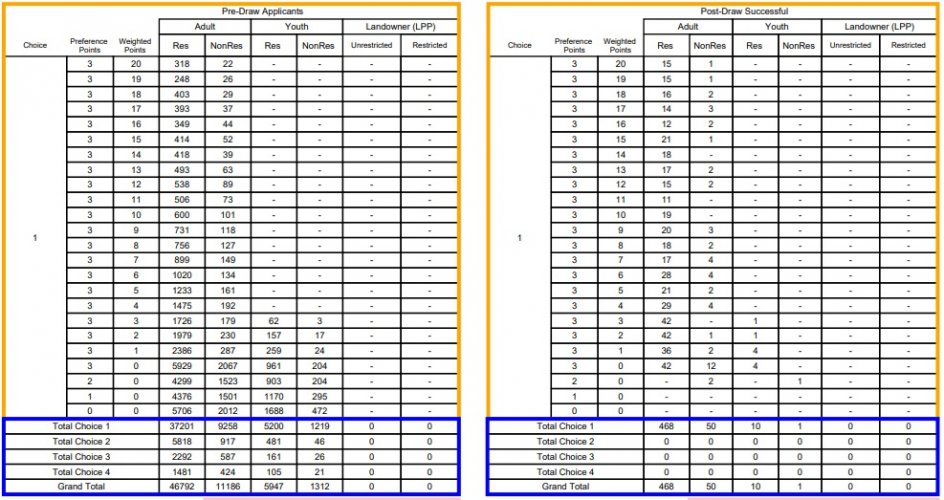
2021MooseRecap.jpg

Ouch, that is ugly! Those with 3+5 or less drew 222 of 478 licenses! It's easy to be steamed over those results and eschew purchasing expensive points moving forward.

However, there are many nuances missing from that raw data. For example, over 21,000 of those applicants applied for a point as their first choice. The pre- and post-draw data combines cow and bull applicants. So I broke all the data down into 1st choice cow and bull applicants, and post-draw successful cow and bull applicants, then calculated the application success rate. So you can decide for yourself whether weighted points help, and if so, do they help enough to justify the cost.
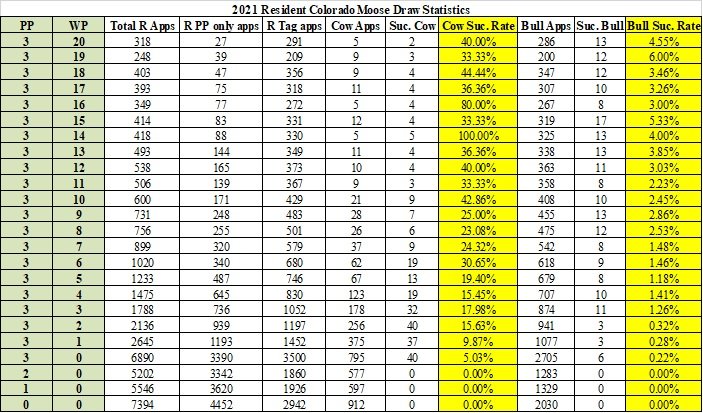
2021RMooseStats.jpg
 
looks to be worth it!

well, if 3% bull odds is 12 extra weighted points $$ worth it than 0.22% - 13x better odds for 600 bones? not bad in my book.

we need someone doing this full time at cpw with a dedicated "points and allocation" PR person to dispel the myths that drive the angst that drive the misinformed comments etc
 
Who knows?! Haha. But I channeled my inner @wllm1313 and set out to see if I could decide for myself.

I chose to look at resident moose statistics for a couple of reasons. First, the volume of applications would smooth out the chance of variability you might see from lower volume NR apps.

Second, it's the hardest species for residents to draw in the state, and the 2021 hunt recap seemed to cause a lot of angst when it showed how many low point holders drew licenses. Let's take a look at the recap:

View attachment 185213

Ouch, that is ugly! Those with 3+5 or less drew 222 of 478 licenses! It's easy to be steamed over those results and eschew purchasing expensive points moving forward.

However, there are many nuances missing from that raw data. For example, over 21,000 of those applicants applied for a point as their first choice. The pre- and post-draw data combines cow and bull applicants. So I broke all the data down into 1st choice cow and bull applicants, and post-draw successful cow and bull applicants, then calculated the application success rate. So you can decide for yourself whether weighted points help, and if so, do they help enough to justify the cost.

View attachment 185216

The way I understand it COs system is better than points squared for low point holders but worse for high point holders.

This is not really how the math works... but it's close-ish so bear with me.

3+20 had 4 applicants... in a straight bonus system that would be 84 entries for them combined.
3+0 had 87 applicants so in a straight bonus system 87 entries combined.

You would therefore give the 3+0 crowd a slight edge in the pulling a tag over the 3+20 crowd, given how many people are in that bucket.

I think that's more the point, per your table there are 21X more people in the 3+0 group than the 3+30 group yet the 3+20 group is pulling 2X as many tags.

So yeah points are worth it... but they don't lock up the system and create the CF that we have for elk/deer/bear.

I think your table shows the system works well.

* youth tags :rolleyes:

1623099690935.png
 
Nice @Oak ! I see you also chimed in and tried to educate on that other, archery-focused, forum on the same thread I did. There are a couple guys that will just not admit that weighted points increase odds of drawing and no amount of math-sharing is going to change that for the majority of the people applying for moose tags in CO.

To your point - the real question shouldn't be 'do they increase odds of drawing?' - because there is no question that they do. It should be 'do they increase odds enough to make it personally worth it for You?'

*I am also happy to see that I arrived at the same numbers as you did (although I only looked at Resident Bull/Either-Sex tags and excluded the 'guaranteed' tags ('M-X-XXX-G1-X' codes)).

we need someone doing this full time at cpw with a dedicated "points and allocation" PR person to dispel the myths that drive the angst that drive the misinformed comments etc

From my interactions with folks (including some very intelligent people) that think 'weighted points don't matter' - PR and Math will not work to get rid of angst or completely dispel the notion that 'weighted bonus points don't matter'. If one person draws with 3+0 and 1 person doesn't draw with 3+20, a bunch of folks think it's unfair. There was an even more detailed look at the Goat draw on the other forum I mentioned 3-4 years ago that was crystal clear, went deep into probability, and somehow the prevailing sentiment was still 'it's only about your random number'.

It is worth a try, of course. I can envision a series of videos like Randy's Public Land explanation video and/or the draw strat videos being helpful.

I will keep buying points for all 3. The spread in odds between the bottom and the top is only going to get worse as application numbers increase at a much higher rate than tag numbers and I for one prefer ~5% odds to ~0.5% odds.

* youth tags :rolleyes:
I think I can infer from the emoji that we think similarly about that topic...


Off-Topic: Anyone have a good OCR tool that's free or close to it for dredging data out of these PDF's? I had airplane time to kill when I was totaling up apps and drawn tags so I just did it by hand, but that's a pain in the butt.
 
Last edited:
Nice @Oak ! I see you also chimed in and tried to educate on that other, archery-focused, forum on the same thread I did. There are a couple guys that will just not admit that weighted points increase odds of drawing and no amount of math-sharing is going to change that for the majority of the people applying for moose tags in CO.

To your point - the real question shouldn't be 'do they increase odds of drawing?' - because there is no question that they do. It should be 'do they increase odds enough to make it personally worth it for You?'

*I am also happy to see that I arrived at the same numbers as you did (although I only looked at Resident Bull/Either-Sex tags and excluded the 'guaranteed' tags ('M-X-XXX-G1-X' codes)).


From my interactions with folks (including some very intelligent people) that think 'weighted points don't matter' - PR and Math will not work to get rid of angst or completely dispel the notion that 'weighted bonus points don't matter'. If one person draws with 3+0 and 1 person doesn't draw with 3+20, a bunch of folks think it's unfair. There was an even more detailed look at the Goat draw on the other forum I mentioned 3-4 years ago that was crystal clear, went deep into probability, and somehow the prevailing sentiment was still 'it's only about your random number'.

It is worth a try, of course. I can envision a series of videos like Randy's Public Land explanation video and/or the draw strat videos being helpful.

I will keep buying points for all 3. The spread in odds between the bottom and the top is only going to get worse as application numbers increase at a much higher rate than tag numbers and I for one prefer ~5% odds to ~0.5% odds.


I think I can infer from the emoji that we think similarly about that topic...


Off-Topic: Anyone have a good OCR tool that's free or close to it for dredging data out of these PDF's? I had airplane time to kill when I was totaling up apps and drawn tags so I just did it by hand, but that's a pain in the butt.
Adobe to excel works decent
 
Here is an analysis showing that in most cases weighed points act just like bonus points. I think when your odds get above 20% or so, some differences arise, but for hard to draw stuff they behave identically. Are they worth the money, well that's a judgement call. If you're sitting at 3+0, then adding one weighted point doubles your chances, so it sounds like a good deal to me. But if you are at 3+20 then the effect is very incremental, so maybe it's not worth it.


Incidentally Oak, before the analysis by toprut there were a few previous attempts to empirically determine how weighted points worked, I think similar to what you tried. Sticksender on Bowsite did an analysis for Mtn Goat, the discussion devolved into a circus. I also analyzed the moose data a few years ago and showed a plot on Monster Muleys. Again proving that trying to discuss math/statistics/probability on the internet is not an efficient use of time. Nonetheless I'll see if I can dig up the moose data.
 
Sticksender on Bowsite did an analysis for Mtn Goat, the discussion devolved into a circus.
That was the one I was referencing above and he went deep - some great 'Probability 101' explanations.

But as you point out - it turned into a sh*tshow so I didn’t link to it (plus, despite their forum's tech platform bordering on ‘unusable’, I guess it’s technically a ‘competitor’ to HT so...)

A Google will find it.
 
Who knows?! Haha. But I channeled my inner @wllm1313 and set out to see if I could decide for myself.

I chose to look at resident moose statistics for a couple of reasons. First, the volume of applications would smooth out the chance of variability you might see from lower volume NR apps.

Second, it's the hardest species for residents to draw in the state, and the 2021 hunt recap seemed to cause a lot of angst when it showed how many low point holders drew licenses. Let's take a look at the recap:

View attachment 185213

Ouch, that is ugly! Those with 3+5 or less drew 222 of 478 licenses! It's easy to be steamed over those results and eschew purchasing expensive points moving forward.

However, there are many nuances missing from that raw data. For example, over 21,000 of those applicants applied for a point as their first choice. The pre- and post-draw data combines cow and bull applicants. So I broke all the data down into 1st choice cow and bull applicants, and post-draw successful cow and bull applicants, then calculated the application success rate. So you can decide for yourself whether weighted points help, and if so, do they help enough to justify the cost.

View attachment 185216
now that you made this maybe you can do the same with the nr sheep odds?!

my personal belief is if I can afford to loose the 100 bucks x3 species for pp and still be able to live then I will do it, maybe it’s foolish as a nr on the bottom end of the points but all it takes is for me to draw one of those tags to feel like it was all worth it.
I'll volunteer to take a shot at the NR Sheep (and to try out the Adobe tool that wllm mentioned)

I did it for Resident Sheep (Ram tags only) 2021 last month (Note - outside of 1 mistake that @Oak called out in an earlier thread, this is only 95% audited)

Picture1.png

Given the smaller # of tags and applicants, there is more chance for variability, but it should look pretty similar for NR's.
 
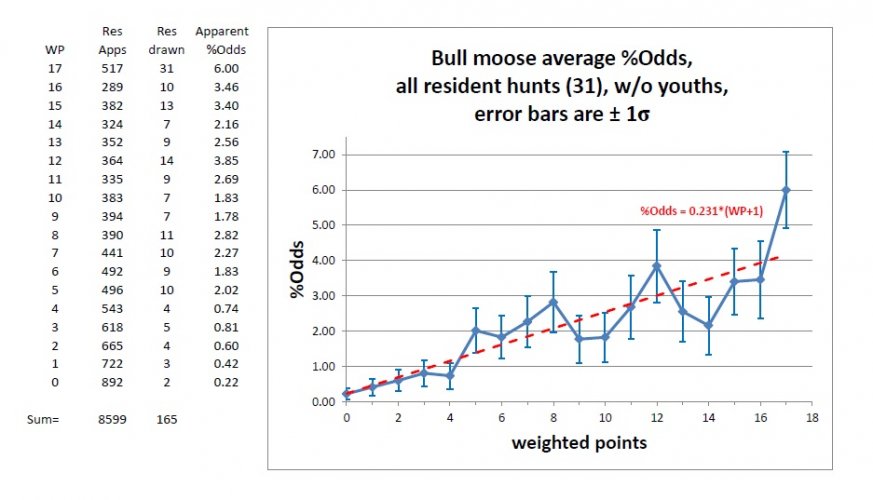
Here is my analysis of the 2018 resident moose data, in graphical form. One problem with these types of analysis is the poor statistical quality of the data, it's hard to make definitive statements. The trend is certainly there, and it suggests behaving like a linear bonus point scheme, but I would not say it's conclusive. Plus you're lumping a bunch of hunts together and hoping everything averages out, so it's not a bulletproof analysis. The Toprut analysis at the individual hunt code level was what was needed.

CO moose all units 2018 with errors.jpg
 
One problem with these types of analysis is the poor statistical quality of the data, it's hard to make definitive statements. The trend is certainly there, and it suggests behaving like a linear bonus point scheme, but I would not say it's conclusive. Plus you're lumping a bunch of hunts together and hoping everything averages out, so it's not a bulletproof analysis.
yep. With so many hunt codes that are, in a lot of cases, wildly different in both tags and applicants, you are spot on.

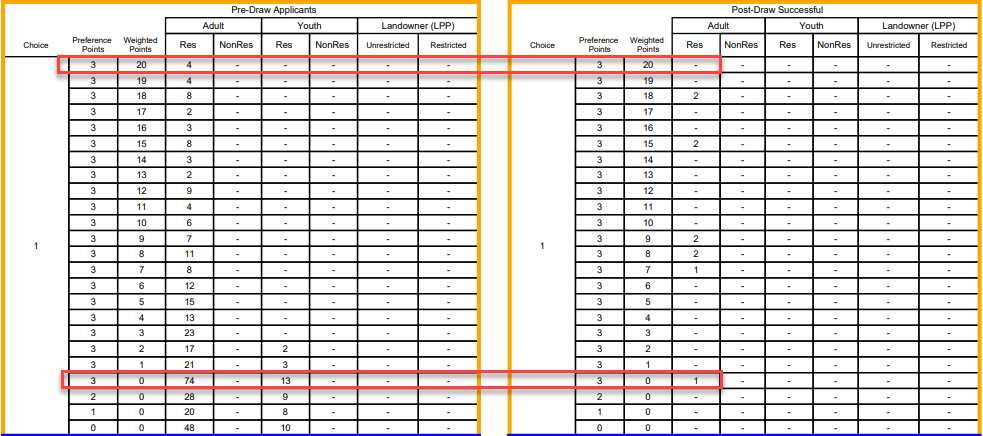
For Example/Exhibit:
now that you made this maybe you can do the same with the nr sheep odds?!
See below

Picture3.png

- Ram Tags only
- Only 1st choice apps at 3+0 and above
- 4001 1st choice apps fit that criteria (1993 applicants for Point only, including the lone 21-point NR)
- So - "Simple" odds overall were 22/4001 = 0.55% (not good)

Because the pool of tags is so small and individual hunt code applicant numbers varied from a low of 35 to a high of 417 (and each hunt code has 1 NR tag), I'd say the data is less solid at an individual point level than, for example, Resident Moose.

But in broader terms - the 'midpoint' of applicants in this model is about 3+4 (meaning ~ half the applicants applied with 0->4 points and about half applied with 5->20 points).

3+0 -> 3+4 = Drew 1 tag
3+5 -> 3+20 = Drew 21 tags

*Disclaimer = I am NOT a statistician nor what I'd consider a data modeling expert. I do hire a lot of the latter and try and keep up with their big brains. I am having a cocktail at a hotel, but it's not a Holiday Inn Express.
 
For those that want to see how the draw works I wrote this up in 2005 for the RMBS.


https://www.coloradooutdoorsports.com/wp-content/uploads/2019/09/HowColoradoSheepGoatDrawWorks.pdf

Not sure who put it on this site without my permission but- Oh Well.

Most of this is still accurate and a good example of how the sheep moose and mt goat draw really works. I'm looking to update this article soon with this years new huge pool of 3 point applicants "coming of age" in the draw. This will be a topic of debate at the next CWC meetings.

My advice/suggestion would be to use the same numbers and keep the current point levels and weighted points system. The change I would make if I was on the CPW Commission or King of the CPW would be to square the weighted points and let that be the new divisor # that would a higher likelihood of a higher weighted point holder drawing a lower final draw number. For example at the 3 & 2 level the person's draw number would be divide by 4 (2 weighted point x 2) A the 3 & 20 level the person's draw number would be divide by 400 (20 weighted points x 20)

Sandbrew
I think the entire problem of the draws through the west is trying to make odds better for a small group of people.

I think the current MSG is a happy medium, I’d be for 3 then straight lottery before squaring points.
 
Someone want to clue me in on the *youth tags :rolleyes:? There is no youth preference for M/S/G. The apps and tags might be parsed out in the recap, but the applicants have zero preference over anyone else in the draw. Or is this just a dislike for youth preference in general?


Good write ups on the points and good discussions about analysis at the overall app level vs. hunt code level. That can and does make a huge difference.
 
Someone want to clue me in on the *youth tags :rolleyes:? There is no youth preference for M/S/G. The apps and tags might be parsed out in the recap, but the applicants have zero preference over anyone else in the draw.

In my case I think I had just not included the youth numbers when I imported the data into Excel because it was in separate columns. As you pointed out there are no special youth tags, so the youth numbers should be merged with the adult numbers. So my analysis has a small error because of this, and I didn't feel it was worth re-crunching the numbers.
 
I think the entire problem of the draws through the west is trying to make odds better for a small group of people.

I think the current MSG is a happy medium, I’d be for 3 then straight lottery before squaring points.

^ this

suggesting to constantly make things better for the minority of old gray heads at the top of the list is why i will have pulled all my hair out before it turns gray

leave msg as is or go straight lottery would be the only options i'm okay with
 
^ this

suggesting to constantly make things better for the minority of old gray heads at the top of the list is why i will have pulled all my hair out before it turns gray

leave msg as is or go straight lottery would be the only options i'm okay with
Agreed. Though if anything it's most unfair for the old grays who are ~3 points from the top 20 tags a year are given and there are 1600 people in front of them. They've been putting in for 19 years and have 0 chance of drawing. They will likely die with 30 points or whatever, having never actually had any chance of drawing a tag in any given year. That to me is a complete scam.

At least younger folks have the advantage of seeing how it's playing out.
 

Latest posts

Forum statistics

Threads
111,093
Messages
1,946,550
Members
35,021
Latest member
Higbee
Back
Top