Honestly is mind blowing even the staff won’t admit they have a problem. It’s clear to me. Will be interesting how bad they will let things get, eastern Montana isn’t the relief valve any longer for a state that struggles to manage mule deer.
Unfortunately, you have to realize that Region 7 is the relief valve because almost a third of the entire state's mule deer harvest comes from the region.
This Chart is bugging me. Partly because of the glaring mistakes in interpretation, but it does show how FWP defines success. The line is Region 7 MD Buck harvest. The description bubbles keep referencing 'population'. It seems FWP declares victory because the Standard Deviation of harvest declines. And they keep equating harvest to population. My first reaction to data like this is something changed in the harvest estimation model.
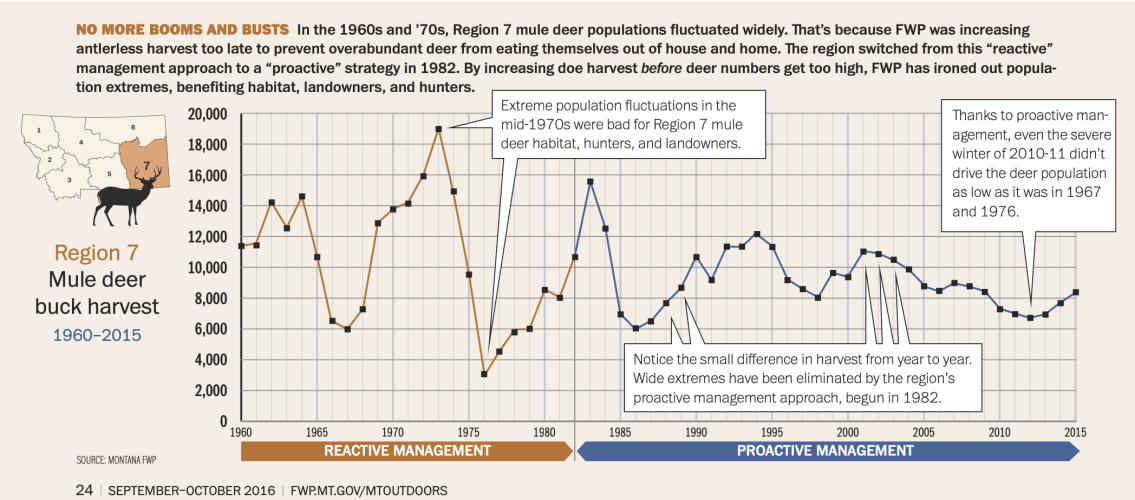
The chart below is from Gohunt MT MD write up. They process the data so I don't have to. There is some overlap in years, but anyone with more than two functioning brain cells can say that drops of 50% and increases of more than 250% is not the definition of stable. Harvest reflects the change in population, from 2008 when total MD harvest was 15,183, in 2012 it dropped to 8,012, and 2016 rebounded to 15,932.
My question is shouldn't FWP focus on population and not harvest, given harvest follows that? And shouldn't we focus on that as well?
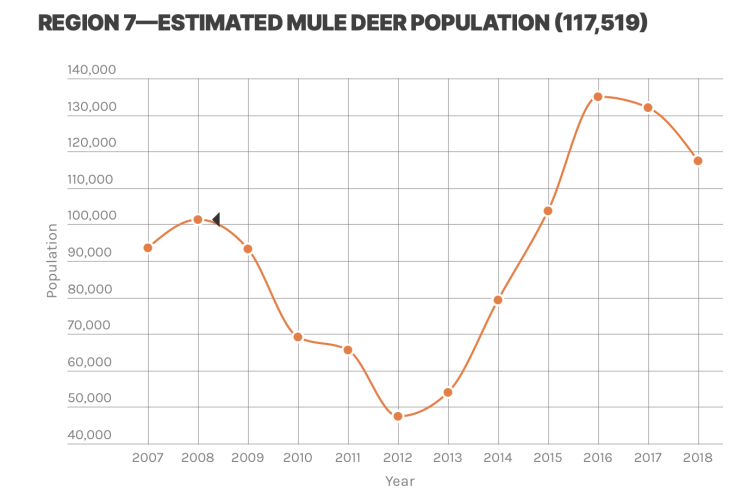
Other crazy things about the data not on chart. In 2012, NRs shot more MD bucks than Rs. A positive is that doe harvest dropped... 6,189 in 2008, 1,072 in 2012, rebounded back to 4,278 in 2016. Great, but from 2016 on it doesn't show the same variability. In 2021, post very bad regional drought, we still shot 2,658 does. My conclusion is I would like to see more proactivity in the tags if they claim it works.