COEngineer
Well-known member
- Joined
- Jul 6, 2016
- Messages
- 1,620
Follow along with the video below to see how to install our site as a web app on your home screen.
Note: This feature may not be available in some browsers.
2005 | 258,370.00 |
2006 | 271,840.00 |
2007 | 291,960.00 |
2008 | 283,210.00 |
2009 | 286,510.00 |
2010 | 283,430.00 |
2011 | 264,170.00 |
2012 | 266,300.00 |
2013 | 264,025.00 |
2014 | 279,490.00 |
2015 | 275,880.00 |
2016 | 277,750.00 |
2017 | 281,700.00 |
2018 | 286,680.00 |
2019 | 292,760.00 |
Kind of like all those 1996-2004 "wolves" around Gardiner, MT driving through in pickup trucks with cow elk in the back that they were taking home to put in their freezers.My personal opinion, (and you know what that's worth) is we had a period in there where most elk died of Chronic Lead Poisoning.
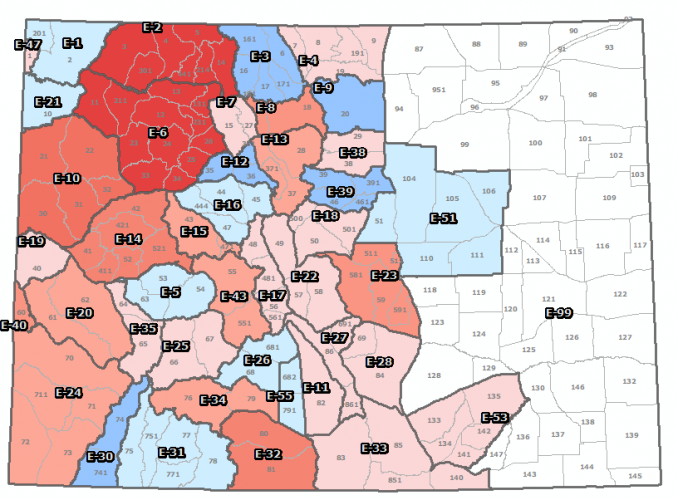
Someone said fun with maps right?This whole elk recruitment bit has left me perplexed recently. On the one side we have hunters complaining and even the CPW claiming elk populations are declining and limiting archery seasons in OTC areas. Then on the other hand, the total population estimates straight from their website do not show a shrinking elk population anymore since 2011. Now, maybe that increasing pop is only in areas such as the Spanish land grants where us mere peasants may not go, but their elk pop number in total does not show this alarming decline.
258,370.00 271,840.00 291,960.00 283,210.00 286,510.00 283,430.00 264,170.00 266,300.00 264,025.00 279,490.00 275,880.00 277,750.00 281,700.00 286,680.00 292,760.00


Where you used to be able to shoot elk in May because they were getting into crops. The population objective for the DAU is zero.
More referring to their clearly very scientific method of "estimating" each year.Where you used to be able to shoot elk in May because they were getting into crops. The population objective for the DAU is zero.
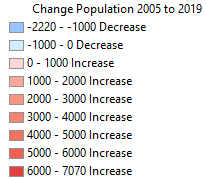
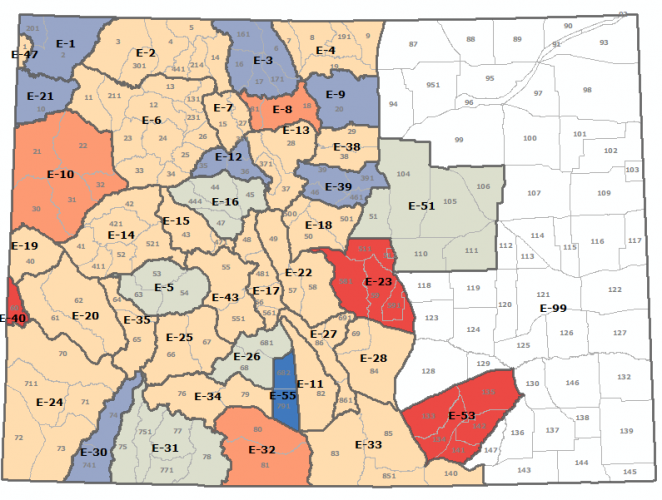
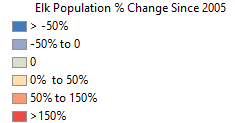
Yep 2019 Population Estimate - 2005 Population EstimateWhat does the map represent? The change in the DAU population over the time period?


13 have Declined. Do you have a link to the population objectives? I can add that into the table and then map it.So 12 DAU have declined in population.
Two DAU don't have management plans (E-21 and E-51). Doubt they want any elk in E-51.
Three are still over the population objective for the DAU (E-1, E-3, E-55).
Five are at the population objective for the DAU (E-9, E-12, E-16, E-26, and E-39).
Two are below the population objective for the DAU (E-31 and E-31).
Absolutely. Similar to MT albeit not to the same degree.To be clear, recruitment is definitely an issue in some DAU, and the impacts of recreation are a huge problem. In some regards, I feel like we are managing some of these populations into a death spiral. Fragmentation and declining quality of habitat, impacts of recreation, vehicle collisions, etc, cause population declines. CPW writes a new herd management plan with a lower population objective (aka, what we currently have) because they claim the habitat will not support the elk. They begin managing for this lower population (hunting licenses), etc.
When a land-use decision comes up and there are concerns about the impacts on wildlife, the proponents can pull out the management plan and say, "Hey, you are at objective in this herd. What's the problem?" Plan gets approved, habitat quality/quantity suffers, populations decline. Rinse, repeat.
13 have Declined. Do you have a link to the population objectives? I can add that into the table and then map it.

Listen guy, I'm a database manager not a cartographer. What colors do you prefer, black like your soulWho picks the color shades for these maps? Cripes.